


Table of Contents
- Defining ROI for Donor Recognition Technology
- Key Performance Metrics and Analytics
- Fundraising Impact Measurement
- Donor Engagement and Behavior Analytics
- Cost-Benefit Analysis Framework
- Long-Term Value Assessment
Defining ROI for Donor Recognition Technology
Understanding the return on investment for donor recognition touchscreens requires a comprehensive approach that measures both quantifiable financial returns and qualitative benefits that strengthen institutional relationships and advancement outcomes.

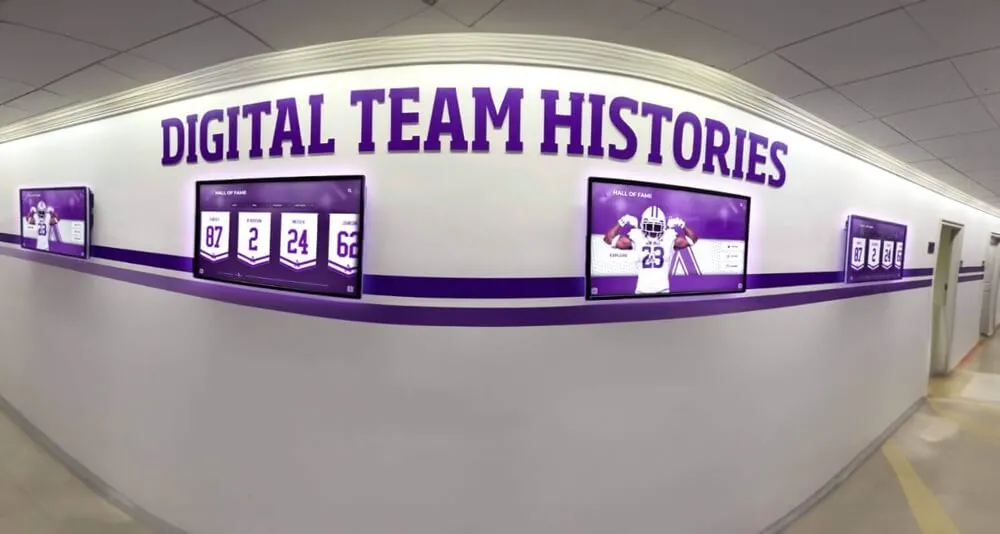
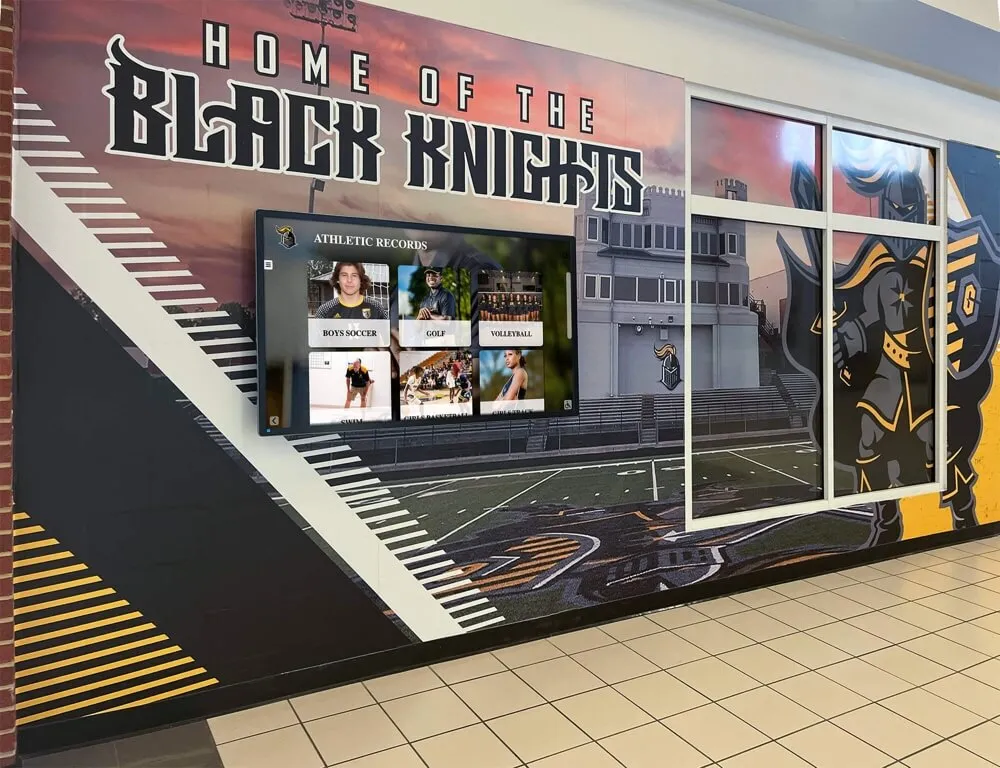
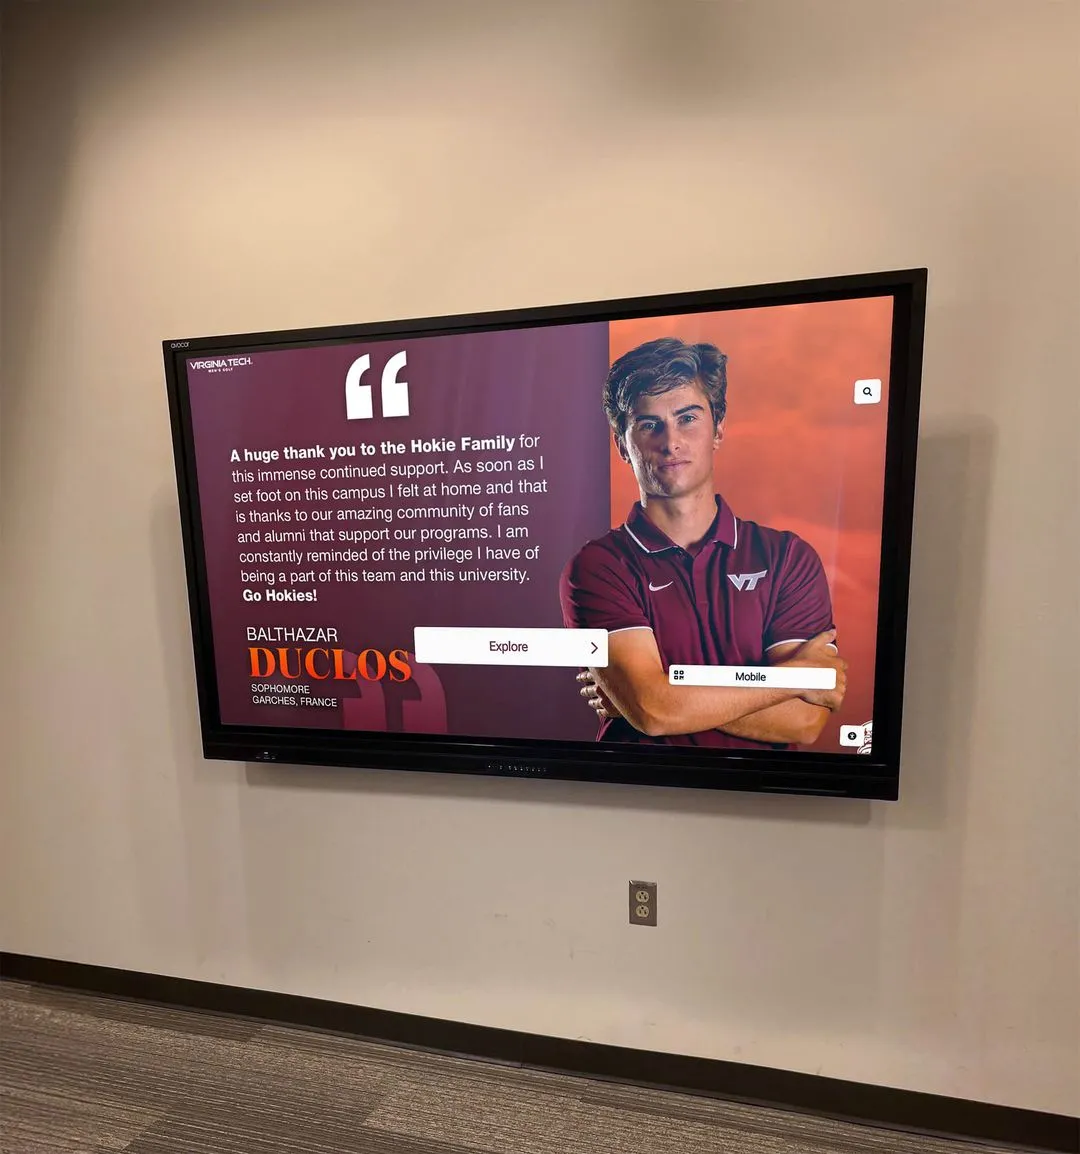
Advanced analytics platforms provide comprehensive ROI data for donor recognition touchscreen investments
The digital donor recognition wall ROI calculation extends beyond traditional technology metrics to encompass donor stewardship effectiveness, advancement office efficiency, and long-term institutional relationship building. Rocket Alumni Solutions analytics platforms provide comprehensive data tracking that enables precise ROI measurement across multiple dimensions.
Financial ROI Metrics
Direct Fundraising Impact
Measurable increases in donation frequency and amounts attributable to enhanced recognition visibility and donor engagement.
- Gift closure rates after recognition exposure
- Average gift size increases
- Recurring donation frequency
Operational Cost Savings
Eliminated expenses from traditional recognition methods including physical plaques, ongoing updates, and maintenance.
- Plaque production and installation costs
- Wall renovation and expansion expenses
- Annual recognition update fees
Staff Efficiency Gains
Time savings in donor recognition processes, content updates, and stewardship activities that translate to cost reductions.
- Reduced recognition processing time
- Automated content management
- Streamlined stewardship workflows
Intangible Value Indicators
Beyond direct financial metrics, interactive donor recognition systems generate substantial intangible value that strengthens institutional advancement capabilities:
- 📈Enhanced Donor Experience
Improved donor satisfaction and engagement through modern, interactive recognition experiences that align with contemporary expectations.
- 🎯Institutional Reputation
Strengthened institutional image through innovative recognition approaches that demonstrate technological leadership and donor appreciation.
- 🔄Process Scalability
Future-proof recognition systems that accommodate growth without proportional cost increases or physical space limitations.
Key Performance Metrics and Analytics
Comprehensive analytics platforms track detailed performance metrics that provide insights into touchscreen donor recognition effectiveness and user engagement patterns essential for optimizing ROI.

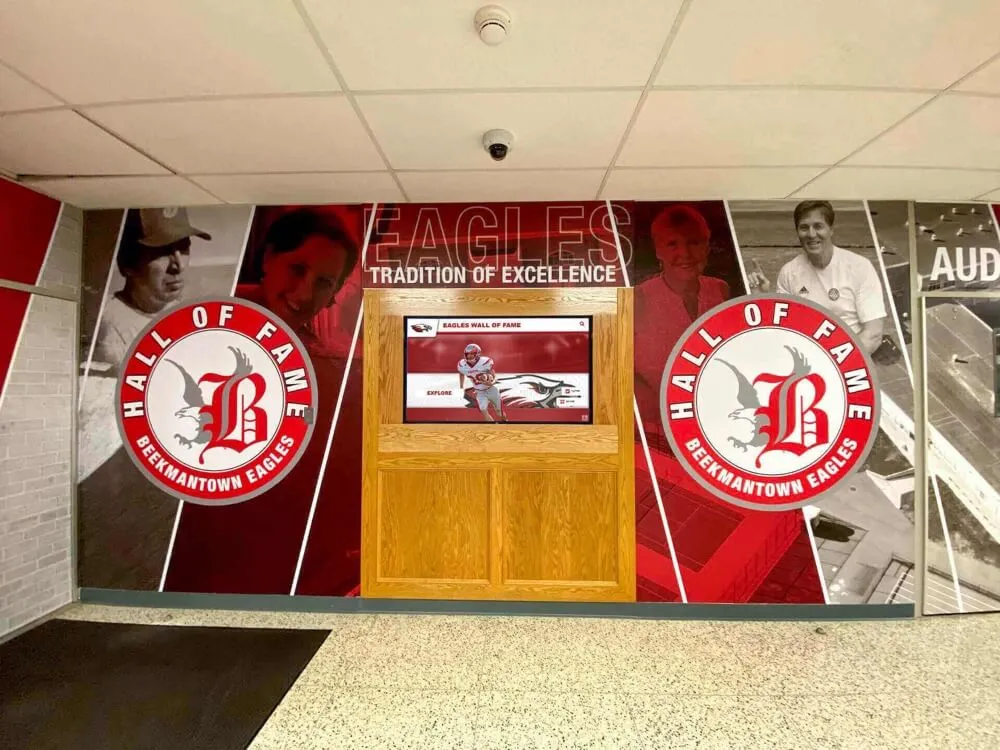
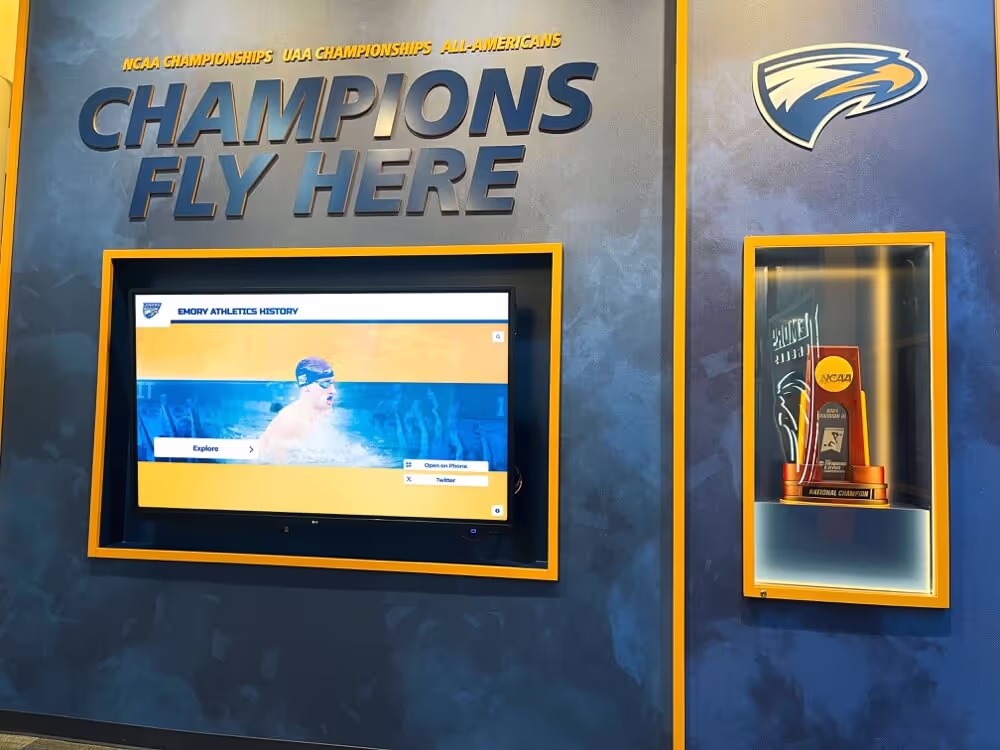
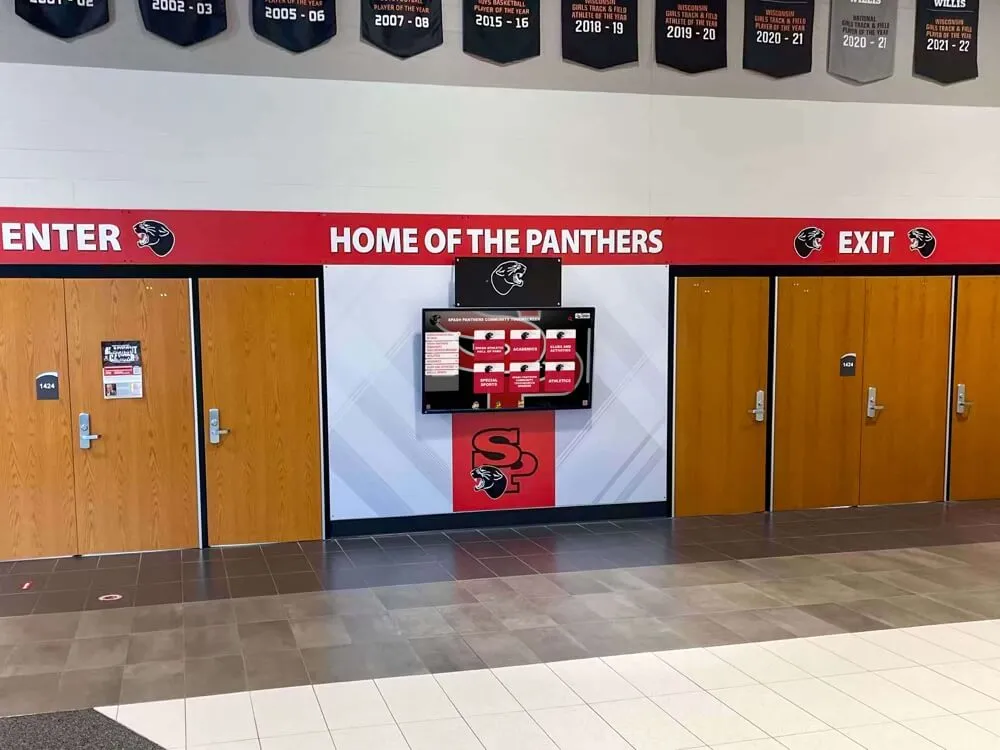
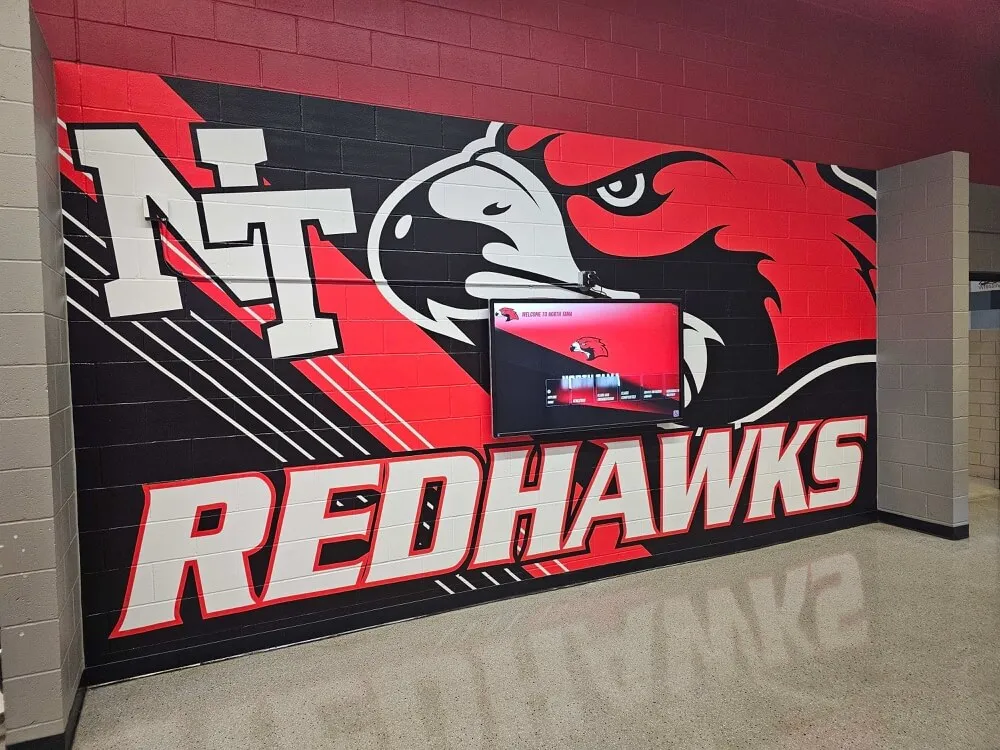
Real-time analytics dashboards track user engagement and interaction patterns for ROI optimization
User Engagement Metrics
Digital donor wall analytics capture detailed user interaction data that reveals recognition effectiveness and visitor behavior patterns:
Interaction Analytics
- Session Duration: Average time visitors spend exploring donor content
- Touch Frequency: Number of interactions per session indicating engagement depth
- Content Exploration: Which donor stories and sections receive most attention
- Search Behavior: How visitors navigate and discover donor information
- Return Visits: Frequency of repeat interactions indicating sustained interest
Content Performance
- Story Completion Rates: Percentage of visitors who view complete donor profiles
- Video Engagement: View duration and completion rates for multimedia content
- Photo Gallery Usage: Image viewing patterns and time spent in galleries
- Search Success Rates: Effectiveness of search functionality in connecting visitors with content
- CTA Performance: Click-through rates on giving links and contact information
Demographic and Behavioral Insights
Advanced touchscreen analytics platforms provide valuable demographic data that helps institutions understand their recognition audience:
- Peak Usage Times
Identification of optimal content update timing and staffing considerations - Visitor Flow Patterns
Understanding how recognition displays integrate with facility navigation - Content Preferences
Which types of donor stories and recognition formats generate strongest engagement

Behavioral analytics reveal visitor interaction patterns that inform recognition strategy optimization
Fundraising Impact Measurement
The most critical ROI component for donor recognition touchscreens involves measuring direct impact on fundraising outcomes, donor behavior, and advancement office effectiveness.
Gift Conversion Tracking
Interactive donor displays enable sophisticated tracking of recognition exposure’s impact on giving behavior:
Donor Lifecycle Value Enhancement
Digital donor recognition systems positively impact donor relationships throughout the entire engagement lifecycle:
Donor Lifecycle ROI Impact
Acquisition
Interactive recognition appeals attract new donors by demonstrating institutional appreciation and impact visibility
Retention
Enhanced recognition experiences strengthen donor satisfaction and encourage continued giving relationships
Upgrade
Visible recognition benefits motivate donors to increase giving levels for enhanced visibility and status
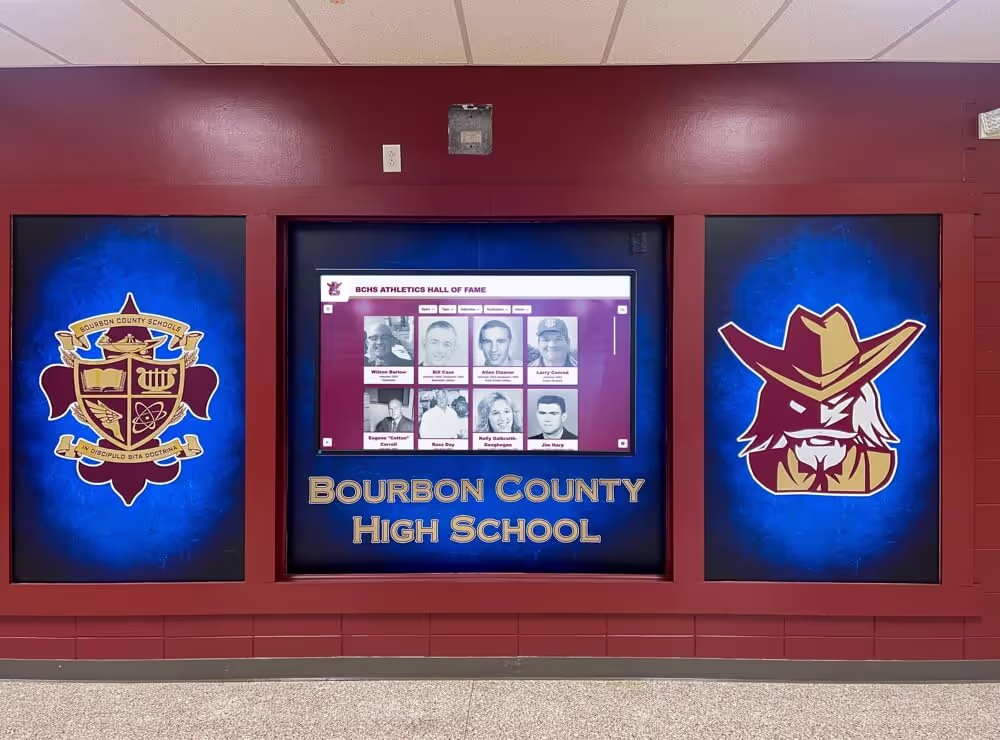
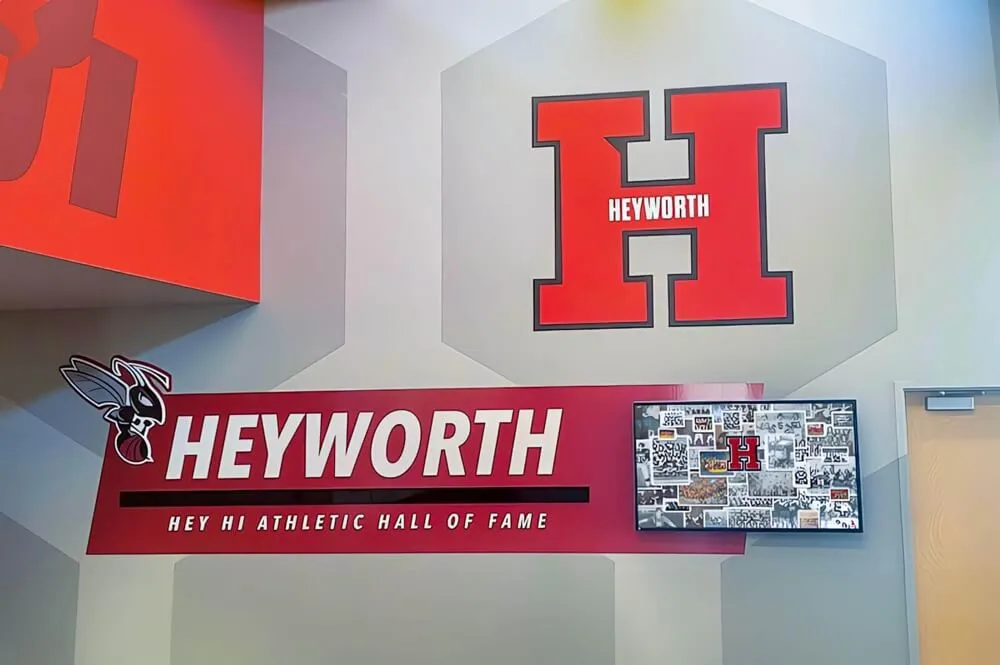
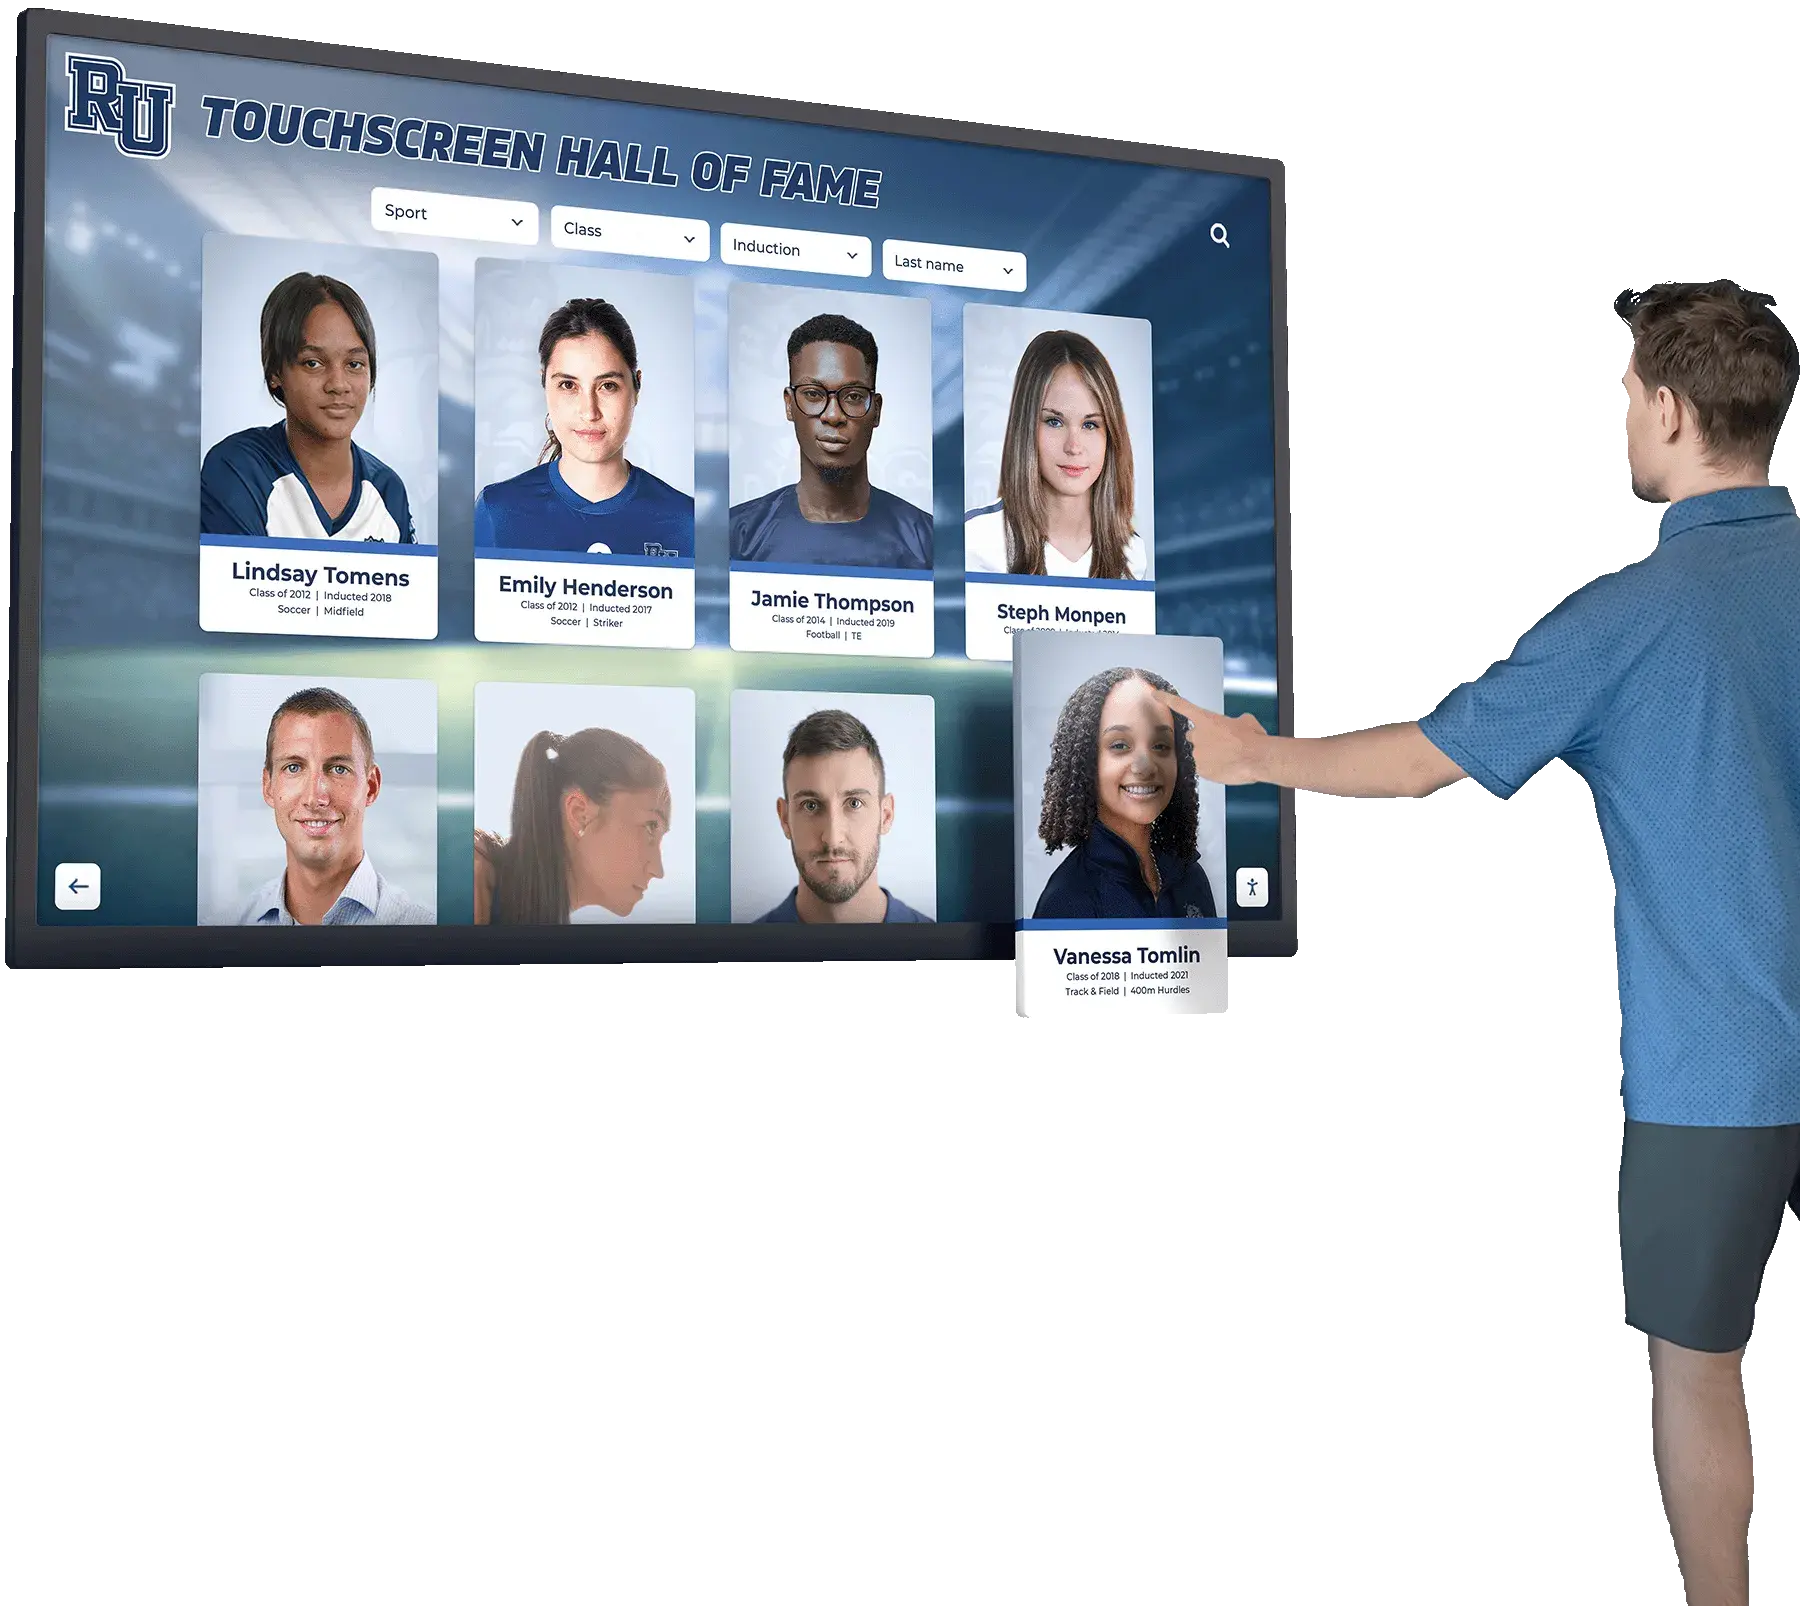
Fundraising impact analytics demonstrate measurable ROI from donor recognition touchscreen investments
Campaign Performance Enhancement
Touchscreen donor recognition systems significantly amplify fundraising campaign effectiveness through:
- Real-Time Progress Display: Live campaign progress updates create urgency and encourage participation
- Peer Recognition Visibility: Showcasing donor participation inspires others through social proof and community engagement
- Impact Storytelling: Multimedia content demonstrates tangible results that motivate continued support
- Immediate Recognition: Instant donor acknowledgment accelerates gift processing and satisfaction
Donor Engagement and Behavior Analytics
Understanding how visitors interact with interactive donor recognition systems provides crucial insights for optimizing content strategy and maximizing engagement effectiveness.
Engagement Depth Analysis
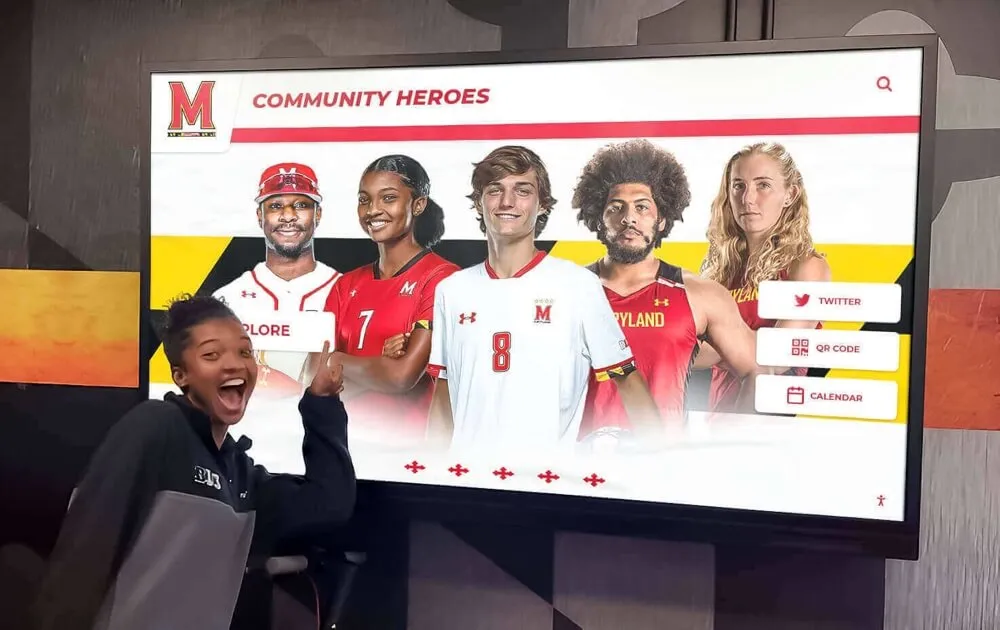
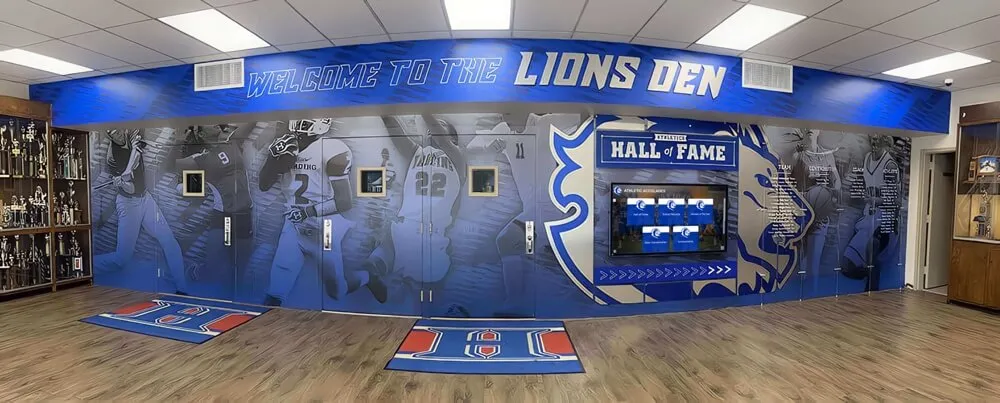
Detailed engagement analytics reveal how visitors interact with donor recognition content and features
The Rocket Alumni Solutions analytics platform tracks multiple layers of engagement that reveal recognition effectiveness:
Surface-Level Engagement
- Initial Touch: First interaction indicating recognition appeal
- Navigation Patterns: How visitors move through recognition content
- Time on Screen: Duration of initial engagement sessions
- Content Sampling: Breadth of content exploration during visits
Deep Engagement Indicators
- Story Completion: Full donor profile and impact story reading
- Media Consumption: Video viewing and photo gallery exploration
- Search Usage: Active information seeking behavior
- Repeat Visits: Return engagement indicating sustained interest
Behavior Pattern Recognition
Advanced analytics identify behavioral patterns that inform recognition strategy optimization:
- Discovery Pathways How visitors find and explore specific donor information
- Content Preferences Which recognition formats and story types generate strongest engagement
- Session Characteristics Typical engagement duration and interaction frequency patterns
- Social Dynamics How group vs. individual usage affects engagement patterns
- Peak Interest Areas Recognition categories and donor segments that attract most attention
- Conversion Triggers Content elements that lead to action or further engagement
Cost-Benefit Analysis Framework
A comprehensive cost-benefit analysis for digital donor walls compares total implementation and operational costs against both financial returns and strategic value creation.
Implementation Cost Considerations
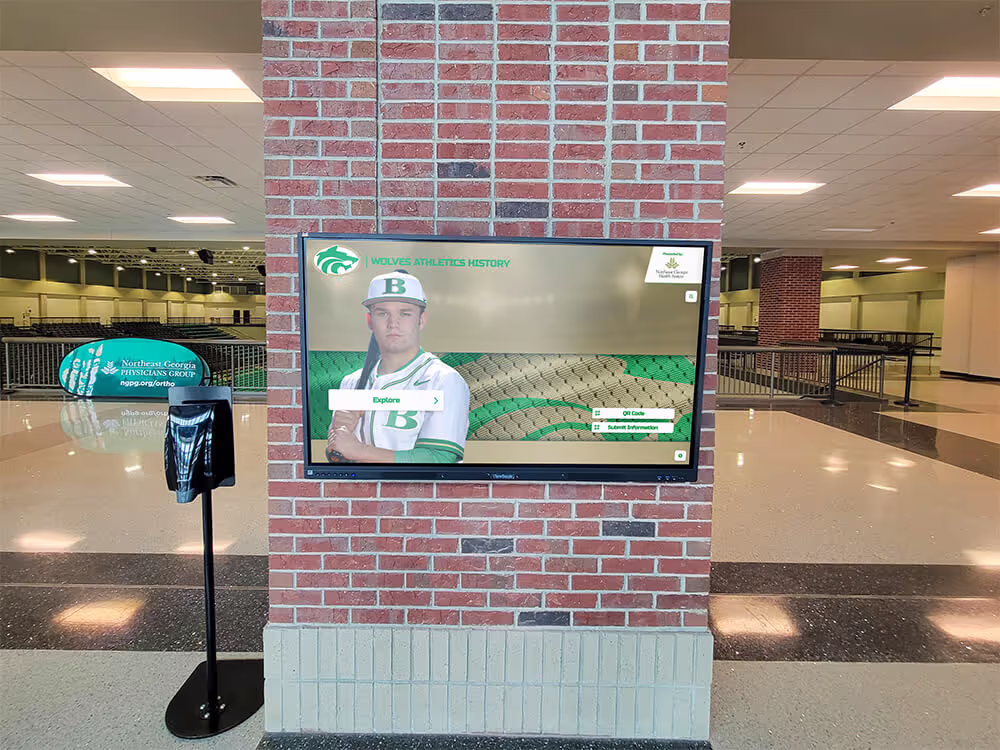
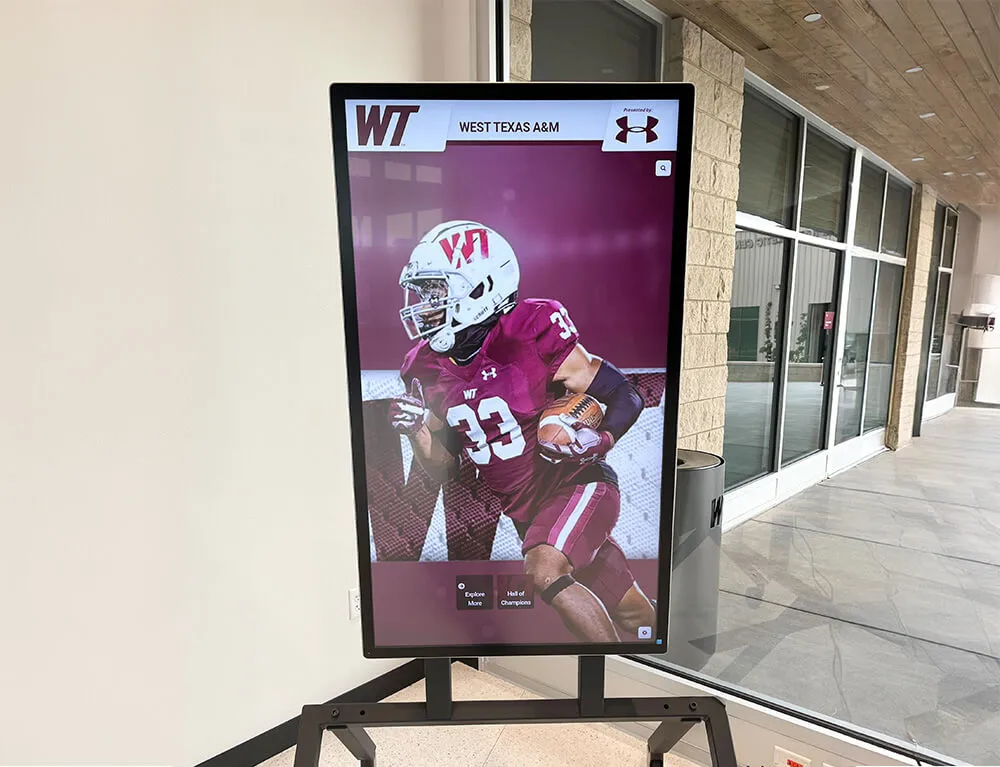
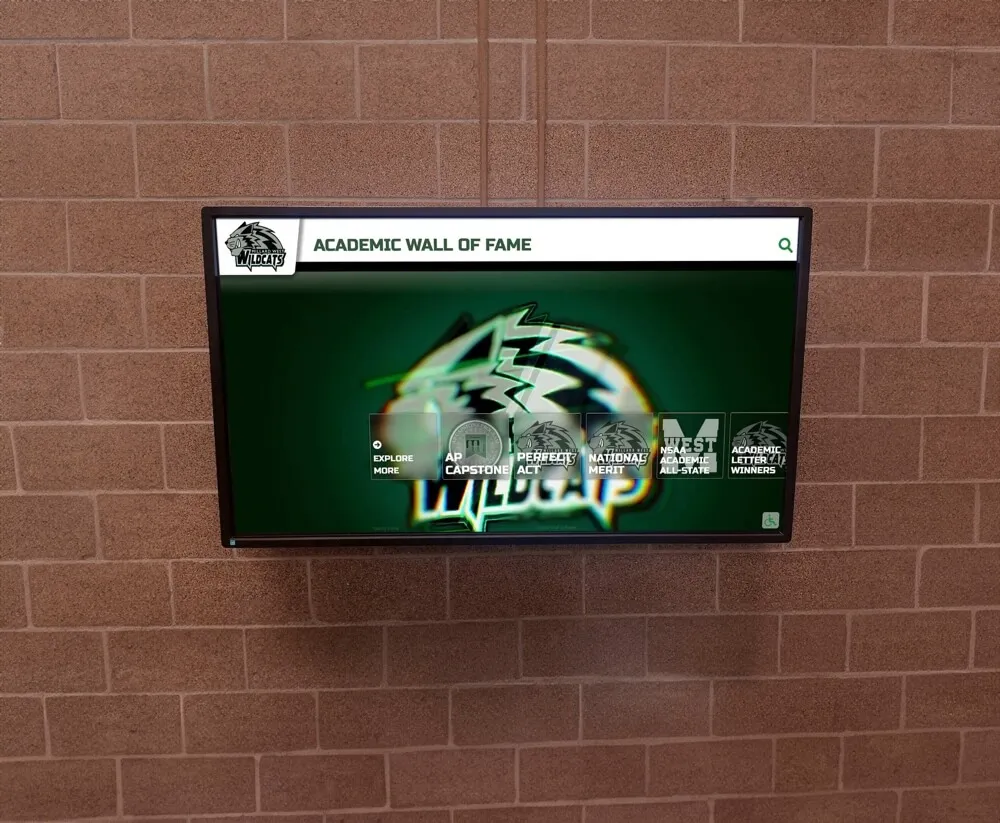
Comprehensive cost-benefit analysis reveals strong ROI for donor recognition touchscreen investments
Touchscreen donor recognition system costs include multiple components that should be evaluated against expected returns:
Initial Investment
- Hardware Costs: Professional-grade touchscreen displays and mounting systems
- Software Licensing: Recognition platform subscription and setup fees
- Installation Expenses: Professional mounting, electrical, and network configuration
- Content Development: Initial donor database setup and story creation
- Training Costs: Staff education and administrative system familiarization
Ongoing Operational Costs
- Software Subscriptions: Monthly or annual platform licensing fees
- Content Updates: Ongoing story creation and database maintenance
- Technical Support: System maintenance and troubleshooting assistance
- Utility Costs: Minimal electrical consumption for display operation
- Insurance Additions: Coverage adjustments for technology installations
Traditional Recognition Cost Comparison
Digital donor recognition walls typically generate substantial savings compared to traditional recognition methods:
5-Year Cost Comparison
Traditional Recognition Walls
- Initial wall construction: $25,000-50,000
- Annual plaque additions: $3,000-5,000
- Wall renovations/expansions: $15,000-30,000
- Maintenance and updates: $2,000-3,000/year
- Total 5-Year Cost: $55,000-95,000
Digital Touchscreen Recognition
- Initial system investment: $15,000-25,000
- Annual software subscription: $2,400-3,600
- Content updates: $1,000-2,000/year
- Maintenance and support: $500-1,000/year
- Total 5-Year Cost: $30,000-45,000
Long-Term Value Assessment
The strategic value of interactive donor recognition systems extends far beyond immediate cost savings, creating lasting institutional advantages that compound over time.
Future-Proofing Benefits
Long-term value assessment demonstrates sustained ROI and strategic advantages of digital recognition systems
Digital donor walls provide strategic advantages that create compounding value over time:
- ∞Unlimited Scalability
Recognition capacity grows without physical space constraints or proportional cost increases, accommodating institutional expansion.
- 📱Technology Evolution
Software updates introduce new features and capabilities without hardware replacement, maintaining cutting-edge functionality.
- 🔄Workflow Integration
Deep integration with institutional systems creates operational efficiencies that improve over time as staff expertise grows.
- 📊Data Asset Development
Analytics data accumulates over time, providing increasingly valuable insights for advancement strategy optimization.
Institutional Reputation Impact
The strategic reputation benefits of modern touchscreen hall of fame systems contribute significant intangible value:
Innovation Leadership
Demonstrates institutional commitment to modern technology and donor experience excellence, attracting forward-thinking supporters.
Accessibility Commitment
Universal design features showcase institutional values of inclusion and accessibility, appealing to diverse donor communities.
Stewardship Excellence
Enhanced recognition capabilities demonstrate sophisticated donor appreciation, encouraging major gift consideration.
Calculate Your ROI Potential
Discover the specific ROI benefits for your institution with personalized analytics and cost-benefit analysis. Our comprehensive assessment tools help quantify both financial returns and strategic value.
Measuring ROI for donor recognition touchscreens requires a holistic approach that considers both quantifiable financial returns and strategic institutional benefits. The comprehensive analytics capabilities available through modern recognition platforms provide unprecedented insights into donor engagement, fundraising effectiveness, and operational efficiency.
Institutions investing in digital recognition technology typically see positive ROI within 18-24 months through a combination of direct fundraising improvements, cost savings, and operational efficiencies. The long-term strategic value—including enhanced donor relationships, improved institutional reputation, and future-proof scalability—continues generating returns for decades.
For comprehensive planning guidance, explore our donor recognition implementation guide and learn about ROI optimization strategies to maximize your recognition investment impact.